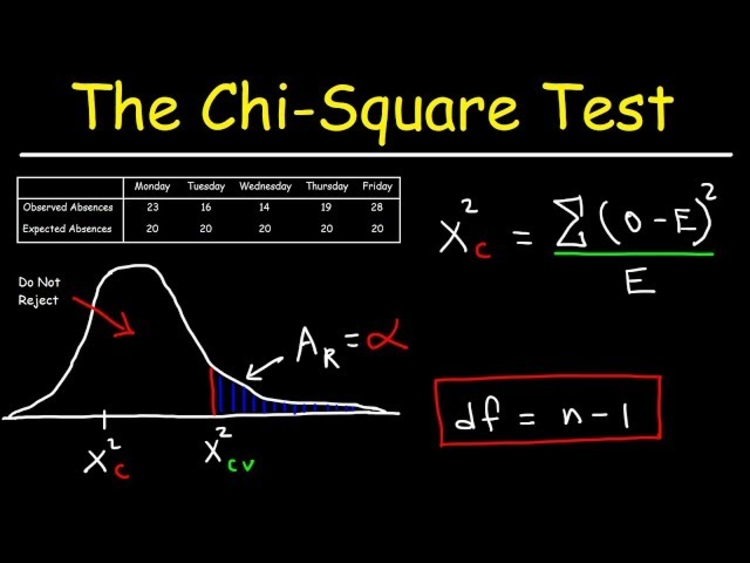
The chi-square test, a cornerstone of statistical analysis, holds the key to unlocking hidden connections within data. It delves into the realm of categorical variables, those discrete classifications like hair color, political affiliation, or ice cream preference, illuminating whether these groupings might be linked. Imagine two variables, eye color and favorite genre of music. Does having green eyes predispose someone to a penchant for rock music? The chi-square test steps in, helping us discern if this observed association is merely random chance or a genuine, statistically significant relationship.
Unveiling the Logic:

The heart of the chi-square test lies in comparing observed frequencies with expected frequencies. We begin by formulating a null hypothesis, stating that there is no relationship between the variables. We then analyze the data, counting how many individuals fall into each category of each variable (like green-eyed rock fans). Next, we calculate the expected frequencies, the number of individuals we would expect in each category if the null hypothesis were true. This involves some statistical magic, accounting for the overall sample size and any existing relationships between the variables.
Finally, we compare the observed and expected frequencies using a chi-square statistic. This statistic, a sum of squared deviations, measures the discrepancy between the two. A high chi-square value suggests a significant difference between observed and expected, casting doubt on the null hypothesis. Conversely, a low value indicates good agreement, lending support to the idea that the observed association is due to chance.
Applications Aplenty:
The chi-square test finds its way into diverse fields, from marketing research, where it can tell us if a new advertising campaign is influencing brand preference, to medical studies, where it can shed light on potential links between risk factors and diseases. In social sciences, it can reveal connections between income levels and voting patterns, while in genetics, it can help identify genes associated with specific traits.
Not Just One Flavor:
Like a versatile chef, the chi-square test comes in different variations, each suited to specific tasks. The chi-square goodness-of-fit test evaluates how well-observed data aligns with a pre-defined expected distribution, like comparing eye color frequencies to a population average. The chi-square test of independence assesses whether two variables are genuinely linked, like the eye color and music example. For data with more than two categories in each variable, the chi-square test for homogeneity compares multiple groups, probing for underlying differences.
Interpreting the Chirp:
Understanding the chi-square test results requires critical thinking. A significant chi-square value tells us the observed association is unlikely due to chance, but it doesn’t automatically imply causation. Further analysis is needed to explore the nature of the relationship and rule out confounding factors. Remember, correlation doesn’t always equal causation!
The Takeaway:
The chi-square test is a powerful tool, illuminating patterns and relationships amidst the often messy world of categorical data. By carefully interpreting its results, we can gain valuable insights, make informed decisions, and advance our understanding of the world around us. So, the next time you encounter a chi-square test, remember, that it’s not just a statistical equation, it’s a detective unraveling the hidden connections within data, whispering secrets of association and dependence.
Conclusion: Unlocking the Secrets of Categorical Data
The chi-square test stands as a testament to the power of statistical analysis in unveiling the hidden connections within data. It delves into the realm of categorical variables, untangling whether observed associations are mere chance or genuine reflections of underlying relationships. From marketing strategies to medical research, its applications span diverse fields, illuminating trends and informing crucial decisions. By comparing observed and expected frequencies, the chi-square test acts as a statistical detective, whispering hints of dependence and correlation. Yet, interpreting its results requires both caution and critical thinking. A significant chi-square value doesn’t automatically paint a picture of causation but rather invites further exploration of the complexities that bind the variables together.
With its diverse variations and potential for insightful discoveries, the chi-square test empowers us to listen closely to the stories woven within categorical data. So, the next time you encounter such data, remember this invaluable tool. Let it be your guide, unearthing the hidden connections and empowering you to make informed decisions based on a deeper understanding of the world around you.
Frequently Asked Questions (FAQs)
 Q: Are there any online resources for learning more about the chi-square test?
A: Yes, many online resources provide detailed explanations and statistics-tutorials on the chi-square test. Some popular options include Khan Academy, Stat Trek, and OpenIntro Statistics.
Q: What are the limitations of the chi-square test?
A: Like any statistical test, the chi-square test has limitations. It assumes independence of observations, and its accuracy can be affected by small sample sizes or sparse data. Additionally, it only indicates association, not causation, and further analysis is needed to explore the nature of the relationship.
Q: When should I use the chi-square goodness-of-fit test versus the chi-square test of independence?
A: Use the chi-square goodness-of-fit test when you have one categorical variable and want to compare its observed distribution to a pre-defined expected distribution. Use the chi-square test of independence when you have two categorical variables and want to assess whether their observed association is statistically significant.
Q: What happens if the chi-square result is not significant?
A: A non-significant chi-square result indicates that the observed difference between observed and expected frequencies is likely due to chance. However, it doesn’t necessarily mean no relationship exists. A larger sample size might be needed to detect a weaker association.


